VTKFIG  0.20.20181114
Easy VTK based in situ visualization
void vtkfig::XYPlot::PlotGrid ( )
private

Plot the label grid.

Definition at line 317 of file vtkfigXYPlot.cxx.

318  {
319  if (PlotState.grid_show)
320  {
321  double xrange[2];
322  double yrange[2];
323  int mynxlabels;
324  int mynylabels;
325 
326 
327  // nice to have but not with opengl2
328  // https://gitlab.kitware.com/vtk/vtk/issues/15799
329  XYPlotActor->GetProperty()->SetLineStipplePattern(0xf0f0);
330  XYPlotActor->GetProperty()->SetLineStippleRepeatFactor(5);
331 
332 
333  if (PlotState.adjust_labels)
334  {
335  XYPlotActor->GetXAxisActor2D()->GetAdjustedRange(xrange);
336  XYPlotActor->GetYAxisActor2D()->GetAdjustedRange(yrange);
337  mynxlabels=XYPlotActor->GetXAxisActor2D()->GetAdjustedNumberOfLabels();
338  mynylabels=XYPlotActor->GetYAxisActor2D()->GetAdjustedNumberOfLabels();
339  }
340  else
341  {
342  XYPlotActor->GetXRange(xrange);
343  XYPlotActor->GetYRange(yrange);
344  mynxlabels=XYPlotActor->GetNumberOfXLabels();
345  mynylabels=XYPlotActor->GetNumberOfYLabels();
346  }
347 
348  // The number of grid lines can change, so there may be more or less
349  // of them in a new plot. We however keep the once allocated vectors
350  // and have to extend them if they are too short.
351  // If they are too long , we switch off the superfluous ones
352  // (via the second argument in SetPlotLines())
353 
354  for (int i=XGridLines.size();i<mynxlabels; i++)
355  XGridLines.emplace_back(XYPlotActor, num_curves,PlotState.grid_rgb);
356 
357  for (int i=YGridLines.size();i<mynylabels; i++)
358  YGridLines.emplace_back(XYPlotActor, num_curves,PlotState.grid_rgb);
359 
360 
361  double dx=0.999999*(xrange[1]-xrange[0])/(mynxlabels-1);
362  double x=xrange[0]+dx;
363  for (int i=1;i<mynxlabels;i++,x+=dx)
364  {
365  XGridLines[i].SetXLine(yrange,x);
366  XYPlotActor->SetPlotLines(XGridLines[i].GetDataSetNumber(), 1);
367  }
368  for (int i=mynxlabels;i<XGridLines.size();i++)
369  {
370  XYPlotActor->SetPlotLines(XGridLines[i].GetDataSetNumber(), 0);
371  }
372 
373 
374  double dy=0.9999999*(yrange[1]-yrange[0])/(mynylabels-1);
375  double y=yrange[0]+dy;
376  for (int i=1;i<mynylabels;i++,y+=dy)
377  {
378  YGridLines[i].SetYLine(xrange,y);
379  XYPlotActor->SetPlotLines(YGridLines[i].GetDataSetNumber(), 1);
380  }
381  for (int i=mynylabels;i<XGridLines.size();i++)
382  {
383  XYPlotActor->SetPlotLines(YGridLines[i].GetDataSetNumber(), 0);
384  }
385 
386  }
387  }
std::vector< GridLine > YGridLines
vector holding grid lines
Definition: vtkfigXYPlot.h:209
struct vtkfig::XYPlot::@4 PlotState
General state of the XYPlot.
vtkSmartPointer< vtkXYPlotActor > XYPlotActor
The main graphics actor.
Definition: vtkfigXYPlot.h:175
int num_curves
Number of all curves including grid lines.
Definition: vtkfigXYPlot.h:172
std::vector< GridLine > XGridLines
vector holding grid lines
Definition: vtkfigXYPlot.h:206

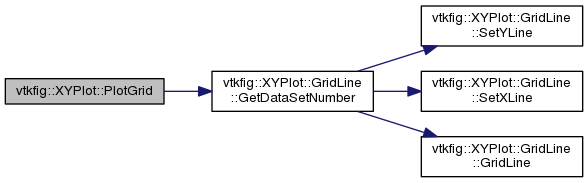
+ Here is the call graph for this function: