VTKFIG  0.20.20181114
Easy VTK based in situ visualization
void vtkfig::Figure::SetData ( DataSet data,
const std::string  name = "" 
)

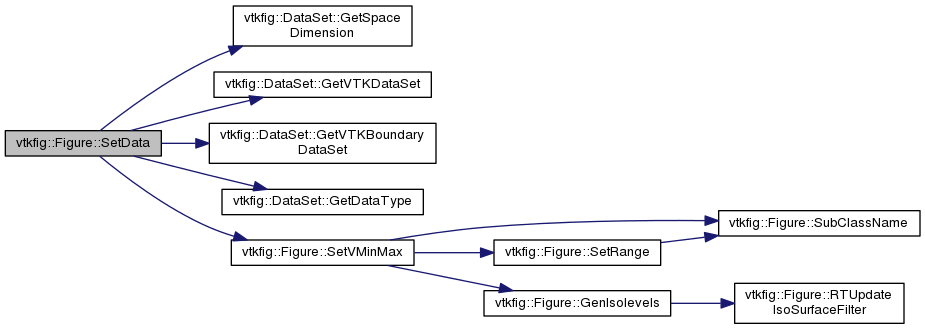
Add Dataset to figure.

Parameters
nameName of scalar or vector to be shown

Definition at line 114 of file vtkfigFigure.cxx.

115  {
116 
117  this->state.spacedim=vtkfig_data.GetSpaceDimension();
118 
119  this->data_producer->SetOutput(0);
120  this->data_producer->SetOutput(vtkfig_data.GetVTKDataSet());
121  this->data_producer->Modified();
122 
123  this->boundary_data_producer->SetOutput(0);
124  this->boundary_data_producer->SetOutput(vtkfig_data.GetVTKBoundaryDataSet());
125  this->boundary_data_producer->Modified();
126 
127  this->coordinate_scale_factor=vtkfig_data.coordinate_scale_factor;
128 
129  state.datatype=vtkfig_data.GetDataType();
130 
131  this->dataname=name;
132  this->celllist=0;
133  this->title=name;
134  this->state.coordinate_scale_factor_xyz[0]=vtkfig_data.coordinate_scale_factor*vtkfig_data.coordinate_scale_factor_xyz[0];
135  this->state.coordinate_scale_factor_xyz[1]=vtkfig_data.coordinate_scale_factor*vtkfig_data.coordinate_scale_factor_xyz[1];
136  this->state.coordinate_scale_factor_xyz[2]=vtkfig_data.coordinate_scale_factor*vtkfig_data.coordinate_scale_factor_xyz[2];
137 
138  // We have to inquire properties of data (ranges etc.) here because
139  // in the rendering pipelines they can be used only once
140  // In fact, we should find a way to move these things to the
141  // corresponding derived classes. Idea:
142  // virtual method ExploreData()
143 
144  // Data for scalar/vector stuff
145  SetVMinMax();
146 
147  // Data for grid visualization
148  auto cr=vtkDoubleArray::SafeDownCast(vtkfig_data.GetVTKDataSet()->GetCellData()->GetAbstractArray("cellregions"));
149  if (cr)
150  {
151  double range[2];
152  cr->GetRange(range);
153  cell_lut->SetTableRange(range[0],range[1]);
154  cell_lut->Modified();
155  if (cbar)
156  {
157  cbar->SetNumberOfLabels((int)(range[1]-range[0]+1));
158  cbar->Modified();
159  }
160  }
161 
162  // Data for grid visualization
163  auto boundary_data=vtkfig_data.GetVTKBoundaryDataSet();
164  if (boundary_data)
165  {
166  auto bcr=vtkDoubleArray::SafeDownCast(boundary_data->GetCellData()->GetAbstractArray("boundarycellregions"));
167  if (bcr)
168  {
169  double range[2];
170  bcr->GetRange(range);
171  bface_lut->SetTableRange(range[0],range[1]);
172  bface_lut->Modified();
173  if (bcbar)
174  {
175  bcbar->SetNumberOfLabels((int)(range[1]-range[0]+1));
176  bcbar->Modified();
177  }
178  }
179  }
180 
181  }
std::string dataname
Name of data item in data set.
Definition: vtkfigFigure.h:256
vtkSmartPointer< vtkScalarBarActor > bcbar
Definition: vtkfigFigure.h:294
double coordinate_scale_factor
coordinate scale
Definition: vtkfigFigure.h:253
vtkSmartPointer< vtkIdList > celllist
Cell mask.
Definition: vtkfigFigure.h:259
void SetVMinMax()
Set minmax values from data.
vtkSmartPointer< vtkLookupTable > bface_lut
Definition: vtkfigFigure.h:276
vtkSmartPointer< vtkTrivialProducer > data_producer
Data producer for grid dataset.
Definition: vtkfigFigure.h:247
std::string title
Title of figure.
Definition: vtkfigFigure.h:262
struct vtkfig::Figure::@0 state
figure state
vtkSmartPointer< vtkTrivialProducer > boundary_data_producer
Data producer for boundary grid dataset.
Definition: vtkfigFigure.h:250
vtkSmartPointer< vtkLookupTable > cell_lut
Definition: vtkfigFigure.h:275
vtkSmartPointer< vtkScalarBarActor > cbar
Definition: vtkfigFigure.h:293

+ Here is the call graph for this function: