43 std::vector<double> inpoints;
44 for(
double x = -2; x < 2; x+=0.03)
46 for(
double y = -2; y < 2; y+=0.03)
48 inpoints.push_back(
xscale*(x + vtkMath::Random(-.1, .1)));
49 inpoints.push_back(
yscale*(y + vtkMath::Random(-.1, .1)));
56 std::vector<double>points;
57 std::vector<int>cells;
62 int npoints=points.size()/2;
64 std::vector<double>values(npoints);
82 std::vector<double> z(npoints);
83 std::vector<double> u(npoints);
84 std::vector<double> v(npoints);
90 double t0=(double)clock()/(double)CLOCKS_PER_SEC;
94 griddata->SetSimplexGrid(2,points,cells);
95 griddata->SetPointScalar(z ,
"v");
96 griddata->SetPointVector(u,v ,
"grad");
99 contour->SetData(griddata,
"v");
100 contour->SetSurfaceRGBTable(colors,255);
101 contour->ShowIsolines(
false);
104 quiver->SetData(griddata,
"grad");
105 quiver->SetQuiverGrid(15,15);
107 contour->KeepXYAspect(
false);
108 quiver->KeepXYAspect(
false);
111 frame->AddFigure(contour);
112 frame->AddFigure(quiver);
117 for (
size_t ipoint=0, ival=0;ipoint<points.size(); ipoint+=2,ival++)
119 z[ival]=
G(points[ipoint+0],points[ipoint+1],t);
120 u[ival]=
dGdx(points[ipoint+0],points[ipoint+1],t);
121 v[ival]=
dGdy(points[ipoint+0],points[ipoint+1],t);
123 griddata->SetPointScalar(z ,
"v");
124 griddata->SetPointVector(u,v ,
"grad");
129 frame->WritePNG(
"example-simplexquiver2d.png");
132 double t1=(double)clock()/(double)CLOCKS_PER_SEC;
136 printf(
"Frame rate: %.2f fps\n",(
double)(i1-i0)/4.0);
137 t0=(double)clock()/(double)CLOCKS_PER_SEC;
static std::shared_ptr< Frame > New()
Create frame with multiple subframes.
static std::shared_ptr< ScalarView > New()
static std::shared_ptr< DataSet > New()
Static constructor of an empty instance.
std::vector< RGBPoint > RGBTable
double dGdy(double x, double y, double t)
double G(double x, double y, double t)
double dGdx(double x, double y, double t)
void Delaunay2D(const V &points_in, V &points, IV &cells)
static std::shared_ptr< VectorView > New()
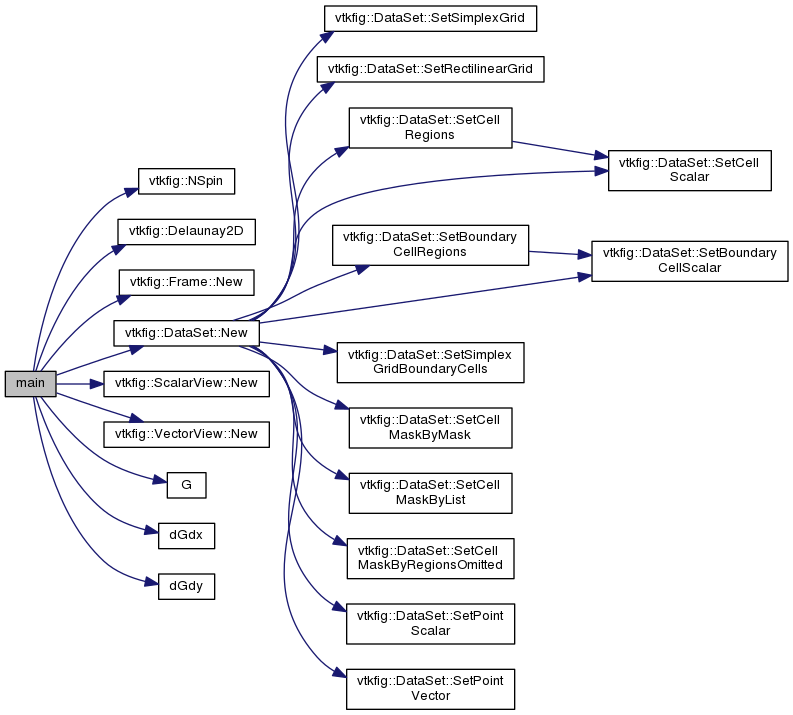
 Here is the call graph for this function:
 1.8.11