|
|
- Examples:
- examples/example-custom.cxx, examples/example-custom1.cxx, examples/example-multifig.cxx, examples/example-rectcontour2d.cxx, examples/example-rectcontour3d.cxx, examples/example-rectquiver2d.cxx, examples/example-simplexcontour2d.cxx, examples/example-simplexcontour3d.cxx, examples/example-simplexquiver2d.cxx, and examples/example-xyplot.cxx.
Definition at line 248 of file example-axis.cxx.
256 frame->AddFigure(plot); 265 for ( int i=0; i<Nx; i++) 266 for ( int j=0; j<Ny; j++) 267 z[j*Nx+i] = G(x[i],y[j],t); 271 for ( int j = 0; j < Ny; j++) 273 for ( int i = 0; i < Nx; i++) 277 vmin=std::min(v,vmin); 278 vmax=std::max(v,vmax); 280 points->GetPoint(k,p); 282 points->SetPoint(k,p); 283 colors->InsertComponent(k, 0,v); 289 gridfunc->Modified(); 291 lut->SetTableRange(vmin,vmax); 298 auto t1=std::chrono::system_clock::now(); 299 double dt=std::chrono::duration_cast<std::chrono::duration<double>>(t1-t0).count(); 303 printf( "Frame rate: %.2f fps\n",( double)(i1-i0)/4.0); 304 t0=std::chrono::system_clock::now(); static std::shared_ptr< Frame > New() Create frame with multiple subframes. double G(double x, double y, double t) static std::shared_ptr< myplot0 > New()
|
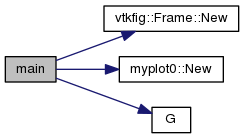
 Here is the call graph for this function:
 1.8.11