|
|
|
[Contents] | [Index] |
Collaborator: D. Davis, H. Langmach, G. Reinhardt
Cooperation with: K. Böttcher, W. Miller, U. Rehse (Institut für Kristallzüchtung, Berlin)
Description:
In 2004 we continued a collaborative project with the Institute for Crystal Growth (IKZ) in Berlin, involving the numerical unsteady flow simulation of semiconductor (GaAs) melt in a vapor-pressure-controlled Czochralski crucible (cf. previous two annual reports; also [1], [2]).
As explained in the above references, the melt-flow behavior and temperature distribution in the crucible are pivotal features which ultimately determine the shape of the crystallization front (see also [3], [4]). Our previous work on GaAs melt-flow simulation concentrated on fully transient flows and their associated time-averaged properties (WIAS Annual Report 2002 , [2]). More recently, we have been concerned with understanding the underlying instability mechanisms, including weakly-nonlinear mode interaction, to provide a more rational explanation for the complex unsteady processes hitherto observed. (A similar procedure has been used in our InP study (WIAS Annual Report 2003 )). After first establishing that the critical Reynolds number (marking the onset of unsteady flow) occurred in the range (1700, 1800), we focused on five cases (Re = 1800, 1900, 2000, 2100, 2200), which all demonstrated oscillatory flow behavior. A Fourier mode analysis was applied to determine the time evolutions of individual azimuthal modes, whereas the dominant frequencies were found by means of discrete Fourier transformations. In Table 1, the dominant frequencies are shown; here we have also included the results from some fully transient cases (Re = 2500, 3000), where pointwise frequencies were no longer discernible, reflecting the relatively ``chaotic'' flow behavior in these cases.

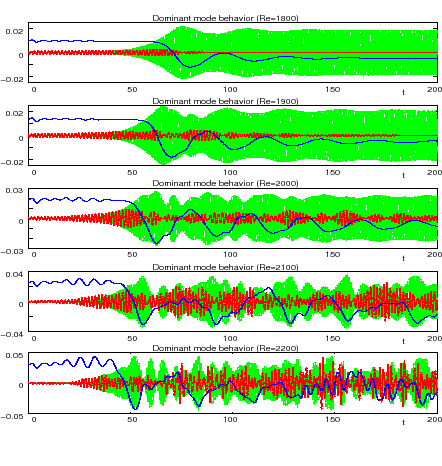
It is clear from the oscillatory cases that the most unstable linear mode is m = 4, but as demonstrated in Figure 1, the dominance of this mode is short-lived, and it quickly gives way to the (nonlinearly-induced) modes m = 8 and m = 16; in this figure, we have focused on the temperature at the point (0.75*RC, 0.33*H), where RC is the radius of the crucible and H is the height of the melt ( H = 0.3 x RC), but we note that the general pattern of behavior observed here is essentially unchanged for other quantities and at other non-axial locations within the crucible.
 |
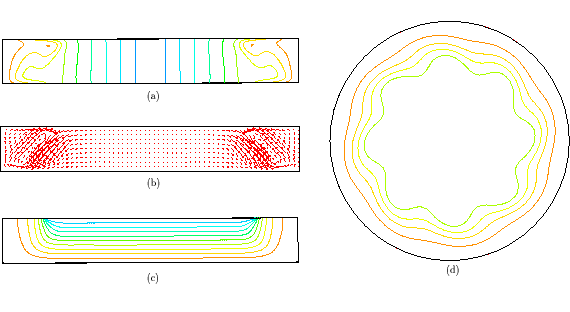
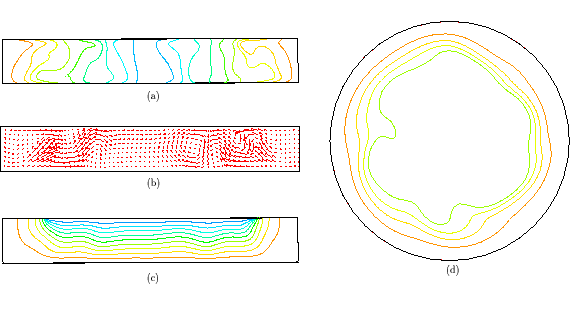
In Figure 2, a snapshot of the temperature is given for the case Re = 1800, where the importance of the m = 8 mode can clearly be seen. (Some higher harmonics---m = 8ki, i = 1,..., r, say---are also active we note, but these do not affect the observed 8-fold azimuthal symmetry, since the greatest common divisor of the dominant modes is 8, i.e. gcd( 8, 8k1,..., 8kr)=8.) In contrast, for Re = 2500 no such simple periodic behavior can be observed (see Figure 3).
 |
 |
References:
|
|
|
[Contents] | [Index] |