|
|
|
|
[Contents] | [Index] |
Collaborator: V. Essaoulova , A. Hutt , S. Jaschke , P. Mathé , H.-J. Mucha , J. Polzehl , V. Spokoiny .
Cooperation with: F. Godtliebsen (University of Tromsø, Norway), G. Torheim (Amersham Health, Oslo, Norway), S. Sardy (Swiss Federal Institute of Technology (EPFL) Lausanne, Switzerland), A. Juditski (Université de Grenoble, France), M. Hristache (ENSAI, Rennes, France), W. Härdle (SFB 373, Humboldt-Universität zu Berlin), J. Horowitz (Northwestern University, Chicago, USA), S. Sperlich (University Carlos III, Madrid, Spain), D. Mercurio (Humboldt-Universität zu Berlin), I. Grama (Université de Bretagne-Sud, Vannes, France), C. Vial-Roget (ENSAI, Rennes, France), A. Goldenshluger (University of Haifa, Israel), Y. Xia (Cambridge University, UK), O. Bunke, B. Droge and H. Herwartz (SFB 373, Humboldt-Universität zu Berlin), H.-G. Bartel (Humboldt-Universität zu Berlin), R. Brüggemann (Institut für Gewässerökologie und Binnenfischerei, Berlin), J. Dolata (Johann Wolfgang Goethe-Universität Frankfurt am Main), U. Simon (Institut für Gewässerökologie und Binnenfischerei, Berlin), P. Thiesen (Universität der Bundeswehr Hamburg), O. Lepski and Yu. Golubev (Université de Marseille, France), A. Samarov (Massachusetts Institute of Technology, Cambridge, USA), S.V. Pereverzev (National Academy of Sciences of Ukraine, Kiev), R. von Sachs (Université Louvain-la-Neuve, Belgium), S. Zwanzig (Uppsala University, Sweden), B. Röhl-Kuhn (Bundesanstalt für Materialforschung und -prüfung (BAM) Berlin)
Supported by: BMBF:
``Effiziente Methoden zur Bestimmung von Risikomaßen'' (Efficient
methods for the valuation of risk measures)
DFG: DFG-Forschungszentrum ``Mathematik für Schlüsseltechnologien''
(Research Center ``Mathematics for Key Technologies''); SFB 373 ``Quantifikation und Simulation
Ökonomischer Prozesse'' (Quantification and simulation of economic
processes), Humboldt-Universität zu Berlin;
Priority Program 1114 ``Mathematische Methoden der Zeitreihenanalyse und
digitalen Bildverarbeitung'' (Mathematical methods for time series analysis and
digital image processing)
Description:
The theoretical basis of the project Statistical data analysis are modern nonparametric statistical methods designed to model and analyze complex structures. WIAS has, with main mathematical contributions, become an authority in this field including its applications to problems in technology, medicine and environmental research as well as risk evaluation for financial products.
Methods developed in the institute within this project area can be grouped into the following main classes.
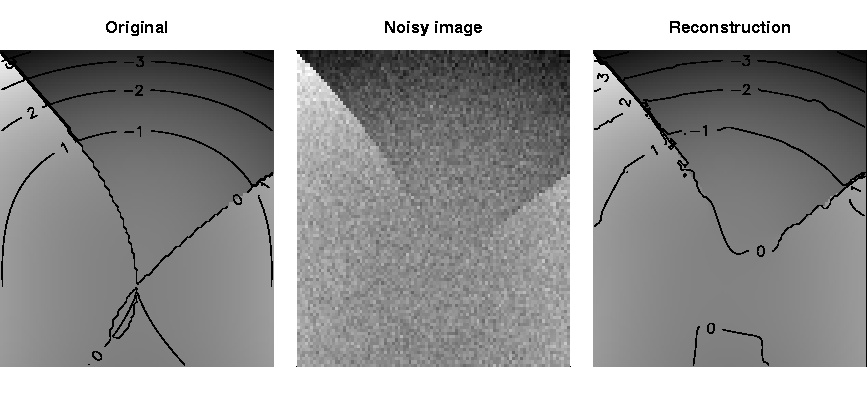
The studies of adaptive smoothing methods have mainly been motivated by applications to medical imaging, especially in the context of dynamic and functional Magnet Resonance Imaging (dMRI and fMRI), and the analysis of high-frequency financial time series. Research on imaging problems is carried out within the DFG Research Center ``Mathematics for Key Technologies'' and the DFG Priority Program 1114 ``Mathematical methods for time series analysis and digital image processing''. Modeling of local stationary time series is based on cooperation within the SFB 373 ``Quantification and simulation of economical processes'' at Humboldt University of Berlin and the BMBF project ``Efficient methods for the valuation of risk measures''. Cooperation also exists with G. Torheim (Amersham Health, Oslo, Norway) and F. Godtliebsen (University of Tromsø, Norway) for the analysis of dMRI experiments.
Two main approaches have been proposed and investigated, a pointwise adaptive approach and adaptive weights smoothing. The pointwise adaptive approach was developed in [37] for estimation of regression functions with discontinuities. [29] extended this method to smoothing of 2D images. The procedure delivers an optimal (in rate) quality of edge recovering and demonstrates a reasonable numerical performance. Other interesting applications of this approach include the analysis of time-varying and local stationary time series and tail index estimation. [25] develop a pointwise adaptive approach for volatility modeling of financial time series. [9] extends this procedure to the case of multi-dimensional financial time series. Appropriate methods for local stationary time series are investigated in [6] and [7]. [5] propose a new method of adaptive estimation of the tail index of a distribution by reducing the original problem to the inhomogeneous exponential model and applying the pointwise adaptive estimation procedure. Although the pointwise adaptive procedure turns out to be asymptotically efficient, its computational complexity is high and results for finite sample sizes are less promising than for the other method called adaptive weights smoothing .
The adaptive weights smoothing approach has been proposed in [30]
in the context of image denoising.
The general idea behind the adaptive weights smoothing
procedure is structural adaptation.
The procedure attempts in an iterative way to recover the unknown local structure from the data
and to utilize the obtained structural information for improving the quality of estimation.
The procedure possesses a number of remarkable properties like
preservation of edges and contrasts and
nearly optimal noise reduction inside large homogeneous regions.
It is also dimension-free and applies in high-dimensional situations.
The original procedure designed for the local constant regression model has been
thoroughly revised and generalized to a wide variety of models. Results have been
presented at several conferences and are contained in
[32, 33].
[32] describes how the AWS procedure can be used for
estimation of piecewise smooth curves or manifolds by local polynomial
approximation.
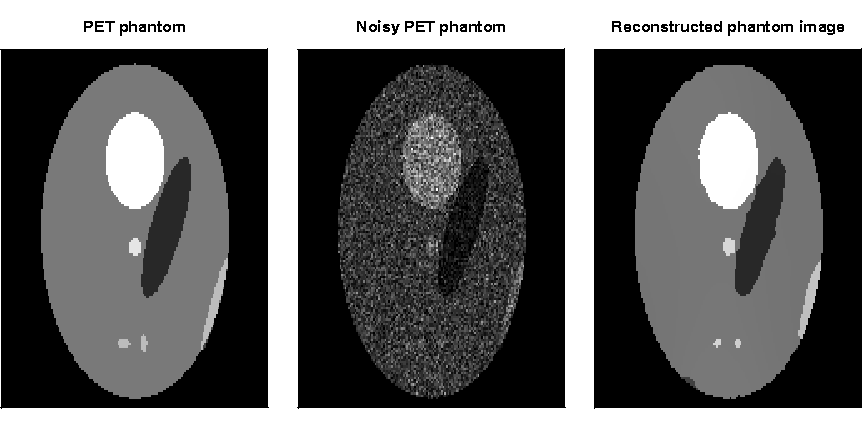
[33] describes an extension of the AWS method to local likelihood estimation for exponential family models with varying parameters as well as applications to various particular problems. Important model classes include Poisson regression, binary response models, volatility models and exponential models. Applications are given for the following problems:

|

|
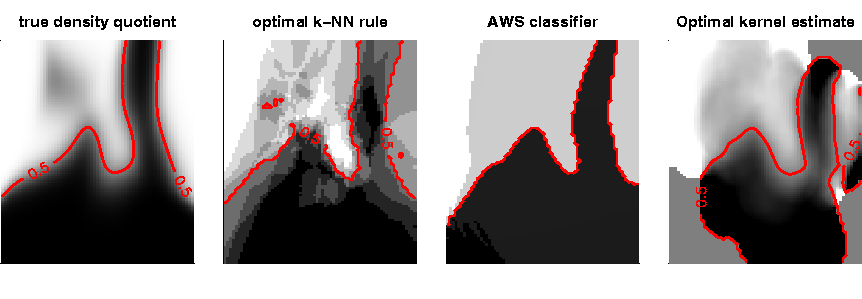
Figure 3 illustrates the classification results obtained for an artificial discriminant analysis problem used in [10] for the adaptive weights, nearest-neighbor and kernel approach using optimal smoothing parameters in the last two methods.
Figure 4 illustrates an analysis of the
DM / US $ exchange rate (data are (C) 2001 by Prof. W. Antweiler University of British Columbia,
Vancouver BC, Canada, and have been obtained from the Pacific Exchange Rate Service
http://pacific.commerce.ubc.ca/xr/data.html). Displayed are the returns ![]() and
estimates of the volatility
and
estimates of the volatility ![]() obtained by the symmetric and asymmetric version of AWS for the time period from January 1993 to December 1997.
obtained by the symmetric and asymmetric version of AWS for the time period from January 1993 to December 1997.
Many statistical applications are confronted with high-dimensional data. Typical examples are given by econometric or financial data. For instance, usual financial practice leads to monitoring about 1000 to 5000 different data processes. Single- and multi-index models are often used in multivariate analysis to avoid the so-called ``curse of dimensionality'' problem (high-dimensional data are very sparse). These models focus on index vectors or dimension reduction spaces which allow to reduce the dimensionality of the data without essential loss of information. They generalize classic linear models and can be viewed as a reasonable compromise between too restrictive linear and too vague pure nonparametric modeling. Indirect methods of index estimation like the nonparametric least-squares estimator, or nonparametric maximum likelihood estimator have been shown to be asymptotically efficient, but their practical applications are very restricted. The reason is that calculation of these estimators leads to an optimization problem in a high-dimensional space, see [18]. In contrast, direct methods like the average derivative estimator, or sliced inverse regression are computationally straightforward, but the corresponding results are far from being optimal, again due to the ``curse of dimensionality'' problem. Their theory applies only under very restrictive model assumptions, see [2], [34] and [40].
[16] developed a structural adaptive approach to dimension reduction using the structural assumptions of a single-index and multi-index model. These models are frequently used in econometrics to overcome the curse of dimensionality when describing the dependencies between variables in high-dimensional regression problems. The new methods allow for a more efficient estimation of the effective dimension reduction space characterizing the model and of the link function. [39] improves on these procedures for single- and multi-index models and generalizes it to the case of partially linear models and partially linear multi-index models.

|
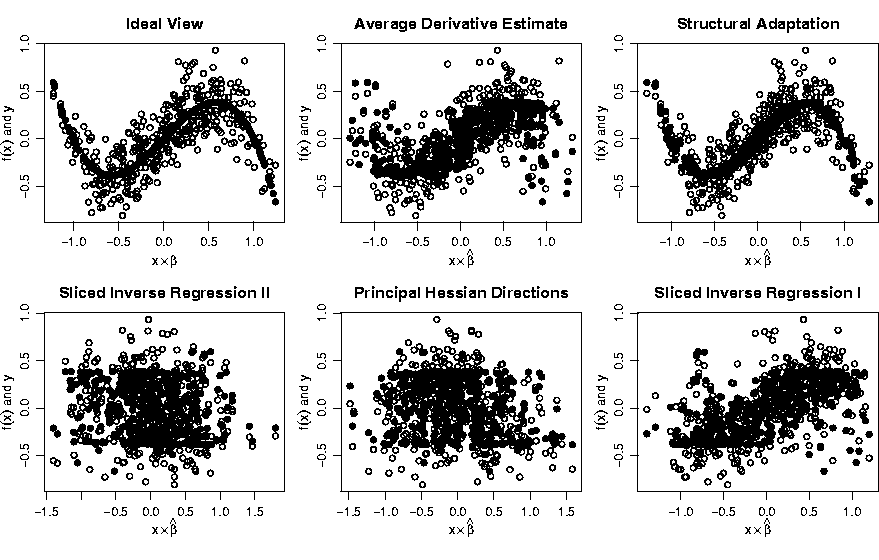
Figure 5 illustrates the quality of the estimated index in comparison to other established methods, i.e. a generalized average derivative estimate (ADE), sliced inverse regression (SIR) and principal Hessian directions (PHD), for a single-index model in a 20-dimensional space. [35] propose a new method to analyze a partially linear model whose nonlinear component is completely unknown. The target here is variable selection, i.e. the identification of the set of regressors which enter in a nonlinear way into the model. As a by-product the method allows to test the dimensionality of the nonlinear component.
Dimension reduction also turns out to be an essential component in the adaptive weights smoothing approaches to time-inhomogeneous time series in case of high dimensions of the parameter space. Methods to handle this problem are currently under investigation.
In many statistical data analyses,
the use of simple models described by
a finite number of parameters
would be preferable. However, an application of parametric modeling
has to be combined with a careful goodness-of-fit test.
In other words, a statistician has to check whether the data really follow
(or, at least, do not contradict) the parametric assumption.
This check can be naturally formulated as
the problem of testing a simple or parametrically specified
hypothesis.
The modern statistical theory focuses on developing tests
which are sensitive (powerful) for a possibly large class of alternatives.
The classical Neyman-Pearson theory considers the very narrow class
of parametric alternatives.
The classical nonparametric procedures like von Mises, ![]() or
Kolmogorov-Smirnov have a serious drawback of being non-sensitive
against a smooth wiggling alternative that typically arises
in the goodness-of-fit problem.
Optimal (in rate) nonparametric tests for such alternatives have been constructed
by [17].
However, practical applications of such rate-optimal tests require to specify
a smoothing parameter.
A number of data-driven (adaptive) tests have been recently proposed
in [3], [4], [19], among others.
[36, 38] considered the problem of adaptive testing
of a simple hypothesis for the ``ideal'' sequence space model
against a smooth alternative and
constructed an adaptive test which is optimal (in rate)
in the class of such adaptive tests.
[38] considered the case of a linear hypothesis for a regression model.
[14] developed an adaptive rate-optimal test
of a parametric hypothesis for a heterogeneous regression model.
[15] extended the method and the results
for the median regression model with an
unknown possibly heterogeneous noise.
or
Kolmogorov-Smirnov have a serious drawback of being non-sensitive
against a smooth wiggling alternative that typically arises
in the goodness-of-fit problem.
Optimal (in rate) nonparametric tests for such alternatives have been constructed
by [17].
However, practical applications of such rate-optimal tests require to specify
a smoothing parameter.
A number of data-driven (adaptive) tests have been recently proposed
in [3], [4], [19], among others.
[36, 38] considered the problem of adaptive testing
of a simple hypothesis for the ``ideal'' sequence space model
against a smooth alternative and
constructed an adaptive test which is optimal (in rate)
in the class of such adaptive tests.
[38] considered the case of a linear hypothesis for a regression model.
[14] developed an adaptive rate-optimal test
of a parametric hypothesis for a heterogeneous regression model.
[15] extended the method and the results
for the median regression model with an
unknown possibly heterogeneous noise.
Cluster analysis, in general, aims at finding interesting partitions or hierarchies directly from the data without using any background knowledge. Here a partition P(I,K) is an exhaustive subdivision of the set of I objects (observations) into K non-empty clusters (subsets, groups) Ck that are pairwise disjoint. On the other hand a hierarchy is a sequence of nested partitions. Having data mining applications and improvement of stability of results in mind some new model-based cluster analysis tools are under development. For example, clustering techniques based on cores can deal with both huge data sets and outliers, or, intelligent clustering based on voting can find usually much more stable solutions. A core is a dense region in the high-dimensional space that, for example, can be represented by its most typical observation, by its centroid or, more generally, by assigning weight functions to the observations. Almost all techniques of high-dimensional data visualization (multivariate graphics, projection techniques) can also take into account weighted observations. As an application in the field of water ecology, a result from model-based Gaussian clustering is presented in the figure below. The data under investigation comes from a snapshot of monitoring of phytoplankton.
Model-based as well as heuristic clustering techniques are part of our statistical software ClusCorr98®. Moreover we offer multivariate visualization techniques like principal components analysis or correspondence analysis as well as other exploratory data analysis. ClusCorr98® uses the Excel spreadsheet environment and its database connectivity.
Ill-posed equations arise frequently in the context of inverse problems, where it is the aim to determine some unknown characteristics of a physical system from data corrupted by measurement errors. Work in this direction is carried out in cooperation with the project Numerical methods for inverse problems and nonlinear optimization of the WIAS research group ``Nonlinear Optimization and Inverse Problems'' and with S.V. Pereverzev, Kiev.
We study problems
![]()
![]()
Modern numerical analysis has developed a rich apparatus, which reflects different aspects of the sensitivity of ill-posed problems. In Hilbert scales such problems were systematically analyzed since Natterer [28]. Sometimes, this restriction does not give a flexible approach to estimating realistic convergence rates. Moreover, some important cases are not covered by the ordinary Hilbert scale theory. One interesting example is given in [1] which studies an inverse problem in optical diffraction.
For these reasons variable Hilbert scales were introduced by Hegland [11] and further developed in [12] and [41]. Within this framework the solution smoothness is expressed in terms of so-called general source conditions, given by some function over the modulus of the operator A involved in the ill-posed equation. These allow to describe local smoothness properties of the solution. Our research was carried out in the following directions.
[8] studied one special statistical inverse problem of reconstructing a planar convex set from noisy observations of its moments. An estimation method based on pointwise recovering of the support function of the set has been developed. It is shown that the proposed estimator is near-optimal in the sense of the order of convergence. An application to tomographic reconstruction is discussed, and it is indicated how the proposed estimation method can be used for recovering edges from noisy Radon data.
References:
|
|
|
[Contents] | [Index] |