|
|
|
[Contents] | [Index] |
Cooperation with: B. Sartorius, D. Hoffmann, H.-P. Nolting, O. Brox, S. Bauer (Heinrich-Hertz-Institut für Nachrichtentechnik, Berlin), H.-J. Wünsche (Institut für Physik, Humboldt-Universität zu Berlin), L. Recke (Institut für Mathematik, Humboldt-Universität zu Berlin), H. Wenzel (Ferdinand-Braun-Institut für Höchstfrequenztechnik, Berlin), M. Umbach (u2t Photonics AG, Berlin), U. Bandelow (WIAS: Research Group 1)
Supported by: BMBF: ``Hochfrequente Selbstpulsationen in Mehrsektions-Halbleiterlasern: Analysis, Simulation und Optimierung'' (High frequency self-pulsations in multi-section semiconductor lasers: Analysis, simulations, and optimization),
DFG: SFB 555 ``Komplexe Nichtlineare Prozesse'' (Collaborative Research Centre ``Complex Non-linear Processes'')
Description:
Optoelectronic devices play a central role in modern telecommunication systems: at the interface between electronical generation and optical transmission of data signals, and more and more also for all optical data processing which opens a perspective to much higher than the conventional processing in the electrical domain. Typically, the semiconductor laser devices which are used in telecommunication systems do not operate in a stationary state but show a complicated dynamical behavior on the timescale of nanoseconds. Dynamical components e.g. for pulse generation, clock recovery, signal regeneration, or fast switching are of particular interest [6, 7, 15].
For the mathematical investigation of such complicated spatio-temporal dynamical behavior, the application and further development of methods from dynamical system theory as well as of special numerical algorithms is necessary. In this way, we can numerically simulate these effects and obtain a theoretical understanding which allows to optimize existing devices or to find new design concepts.
This research project is concerned with a broad range of questions, including modelling, numerical simulation, and optimization as well as the theoretical investigation of the models and their dynamical properties. The software LDSL-tool provides a comprehensive toolkit to simulate and analyze monolithically integrated edge emitting multi-section lasers. It is used in the framework of an industrial cooperation project to optimize the performance and robustness of an electrically modulated pulsating laser (see §3).
Our analytical and numerical investigations are based on models of the structure
 |
(1) |
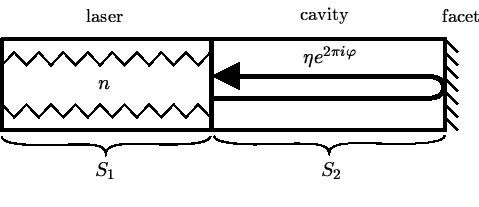
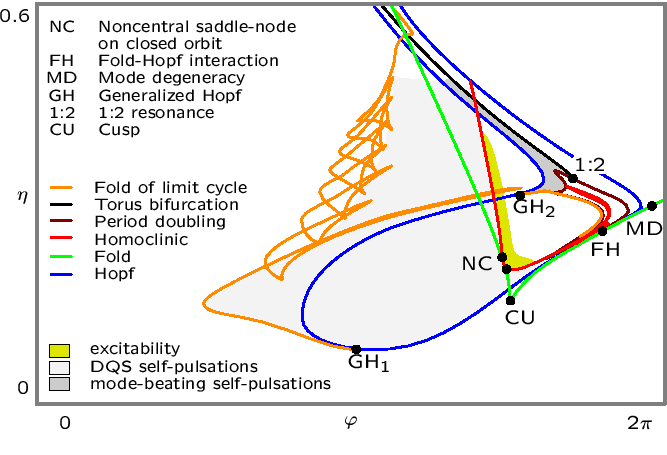
A central theme of the report period was the investigation of the mode degeneracy (see §1, [3, 4]). It turned out that this singularity is caused by delayed optical feedback. Hence, the feedback configuration of Fig. 1 is already able to exhibit many different dynamical regimes of practical interest: excitability (see §2), DQS self-pulsations, mode beating self-pulsations, chaotic behavior (see §1). Using analytical methods of bifurcation theory and numerical path-following techniques, we were able to obtain a complete description of the complicated dynamics (see Fig. 2). Moreover, this analysis served as a guide to find the phenomenon of excitability in numerical simulations of model (1) and also, for the first time, in corresponding laser experiments (see §2, [8, 10]).

|
In [10], we perform a numerical bifurcation analysis for a multi-section laser device implementing a classical delayed optical feedback experiment (see Fig. 1). This laser consists of an active DFB section S1 acting as a laser and a passive Fabry-Perot section S2 providing accurately tunable delayed optical feedback.
The bifurcation diagram in Fig. 2 shows how the dynamics
of this laser depends on the parameters ![]() and
and ![]() , which can be
controlled in the experiments by changing the temperature and the
current input of section S2.
, which can be
controlled in the experiments by changing the temperature and the
current input of section S2.

|
Fig. 2 has been obtained using the two-mode approximation including the two eigenvalues of H(n) which have a critical mode degeneracy at MD (double eigenvalue of H(n) on the imaginary axis). It reveals the sources of many nonlinear phenomena observed in experiments and simulations and locates them in the parameter plane. The following is of particular interest for applications:

|
The theoretical study of this problem is based on the traveling wave (TW) model (1) and its two-mode approximation system. It has allowed to adjust suitable experimental conditions and to find excitability in real DFB lasers (see [8]).
The simulations of the TW model have shown that the parameter region where an excitable stable stationary state exists is neighboring a parameter region with self-pulsating solutions. By using the two-mode approximation system we were able to identify homoclinic bifurcations which separate the parameter region of stable self-pulsations from the region where excitability has been observed (see the red line in Fig. 2).
Now the mechanism of excitability can be easily explained by Fig. 4, presenting suitable projections of two stable and of saddle-type stationary states (solid and empty big points), unstable limit cycle (green curve), already broken homoclinic loop (blue trajectories tending to and outgoing from the saddle), and the trajectory of the responding signal (red curve). In these figures, yellow and blue shaded areas indicate carrier densities supporting the growth of the first and of the second mode, respectively.
At the beginning, the system is operating at the stable stationary state s1. Then, a perturbation caused by an injected pulse is acting along the thick arrow. If the perturbation is small, the field-density state remains close to the stationary state s1, and after some decaying oscillations the trajectory returns to this state.
In the case when the perturbation is strong enough, the field-density state point can be kicked to the left side of the thick blue curve which indicates a part of the stable manifold of the saddle and defines the threshold perturbation. The response trajectory makes a large excursion in the phase space bypassing the saddle stationary state s1' and entering the blue shaded region where the second mode becomes dominant. After returning to the plane where the first mode dominates (yellow shaded part and below in the right part of Fig. 4), the trajectory is attracted by the state s1.
In order to demonstrate locking in the model, the modulation frequency fext should be sufficiently close to the frequency f0 of self-pulsations in the free running laser. Then, if the modulation amplitude is big enough, one can expect to have the required locking (see blue shaded area in the left diagram of Fig. 5).
To demonstrate locking we apply a sampling technique and draw eye diagrams used frequently in engineering (see the three middle diagrams of Fig. 5). The considered three cases show the behavior of the TW model (1) with included optical field noise terms when the current modulation of the DFB section was applied. The frequencies and amplitudes of this modulation are indicated by coloured small squares in the left diagram of Fig. 5. An open eye in the third of the middle diagrams indicates locking of the self-pulsations to the frequency of modulation. Finally, the right part of Fig. 5 shows the drift of pulse maxima in the eye diagram. The drift along the horizontal line (red trace in the right part of Fig. 5) indicates an almost constant position of each pulse in the eye diagram, and, therefore, guarantees an open-eye diagram. On the contrary, if the pulse maximum is drifting over more than one period (blue and green traces in the right part of Fig. 5), then the eye in the corresponding diagram will be closed.
This way, the pictures show how the developed software allows to analyze the quality of the self-pulsations and to determine the locking regions.
References:
|
|
|
[Contents] | [Index] |