|
|
|
|
[Contents] | [Index] |
Cooperation with: U. Pirr (Humboldt-Universität zu Berlin)
Description: In the period under review, the support for the graphical display of numerical results (for the whole institute) has been successfully continued. For the research groups ``Numerical Mathematics and Scientific Computing'' and ``Stochastic Algorithms and Nonparametric Statistics'', videos were produced in MPEG and VHS formats.
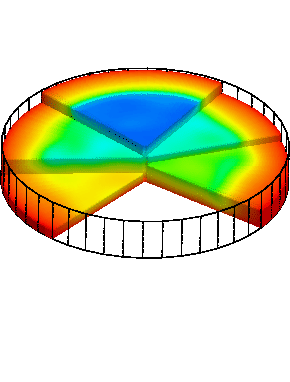
We supplemented our software equipment with the visualization tool ``AVS/Express'' and the tool for digital video editing ``Adobe Premiere''. The new visualization tool was required owing to the increase in visualization tasks in our institute. This is especially true in the field of computational fluid dynamics, where the simulation of unsteady, three-dimensional problems has produced large quantities of data, which required a modern and powerful visualization tool. Figure 1 shows several slices in a diagram of a simulation of melt flow during crystal growth; it was produced by the new visualization tool using data from one simulation step, and is 63 MBytes (360000 nodes, 265000 tetrahedra) in size.
The tool for digital video editing is applicable only for systems of
personal computers.
The change from the ``workstation world'' to the
``PC world'' was necessary, given the greater diversity of the PC tool. It
has proven to be the case that
tasks requiring digital video editing are better solved with software
on PCs than with software on the operating system UNIX.
For the archiving of the visualization data and to ease the burden on
our central file server, we have equipped one of our computers with a
larger local harddisk capacity.
For the exhibition to celebrate the 10th anniversary of the
``Forschungsverbund Berlin e.V.'' in February 2002, we displayed and
demonstrated our equipment used for visualizing
simulation data to a wider public.
|
|
|
[Contents] | [Index] |