|
|
|
[Contents] | [Index] |
Cooperation with: U. Pirr (Humboldt-Universität zu Berlin)
Description: In the period under review, the support for the graphical display of numerical results (for the whole institute) has successfully been continued. For the Research Groups 1 and 7, videos were produced in MPEG and VHS formats.
It was also necessary to transform some of these videos to a format compatible for PCs (such as AVI and Quicktime).
Some complex graphical presentations of mathematical objects
(non-simple curves such as Cassini's curve (see page
![]() ) and other
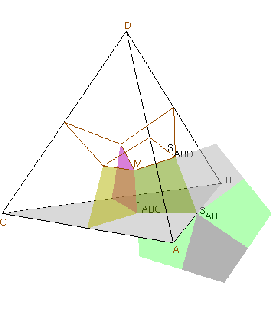
complex designs (Fig. 1))
were created directly using the programming language C and the OpenGL-API
(application programming interface).
) and other
complex designs (Fig. 1))
were created directly using the programming language C and the OpenGL-API
(application programming interface).
Our hardware equipment was supplemented by a digital video recorder (miniDV format), which allows high-quality videos to be archived. The recorder can also be used as playback equipment when connected to a normal television set. It can further be used for lecture presentations.
It was shown that our anticipatory policy of purchasing equipment pays
dividends. The visual workstation Silicon Graphics Octane2 (tm) with
the high-performance graphics subsystem VPro V12 was a basic necessity for
establishing cooperation with an industrial partner (see page
![]() ).
).

|
|
|
|
[Contents] | [Index] |